matplotlib (11)
-
 [matplotlib] 박스플롯(boxplot) 해석하기
2022.11.04
 -
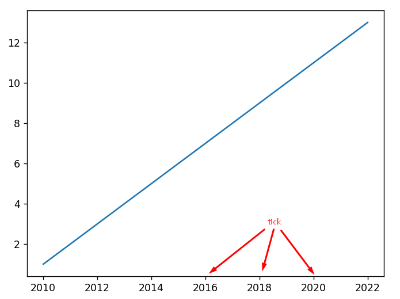 [matplotlib] 그래프 x축, y축 눈금 위치 설정하는 방법, xticks, yticks
2022.07.04
 -
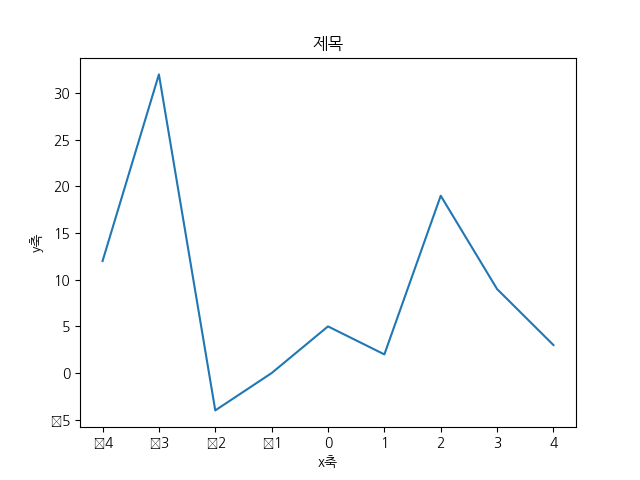 [matplotlib] 리눅스 우분투 matplotlib 그래프 한글 깨짐 문제 해결법
2022.07.02
 -
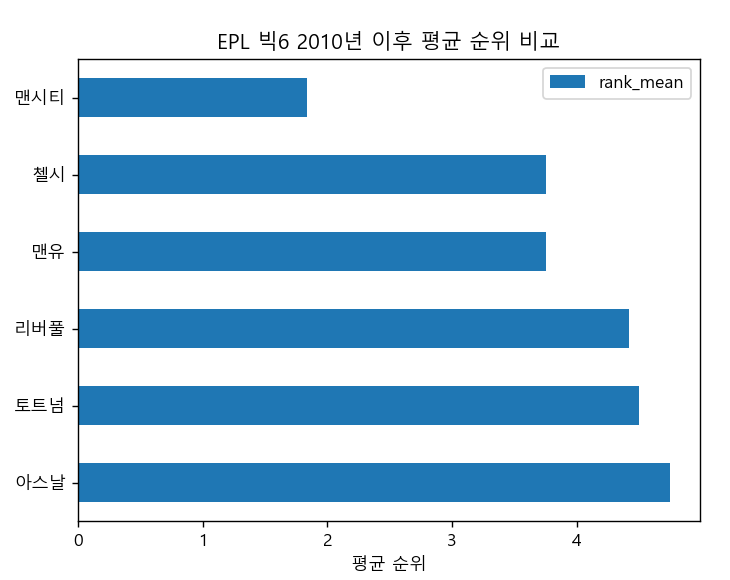 [pandas, matplotlib] EPL 빅6 팀의 2010년 이후 순위 비교 그래프 그리기(선 그래프, 막대 그래프)
2022.06.28
 -
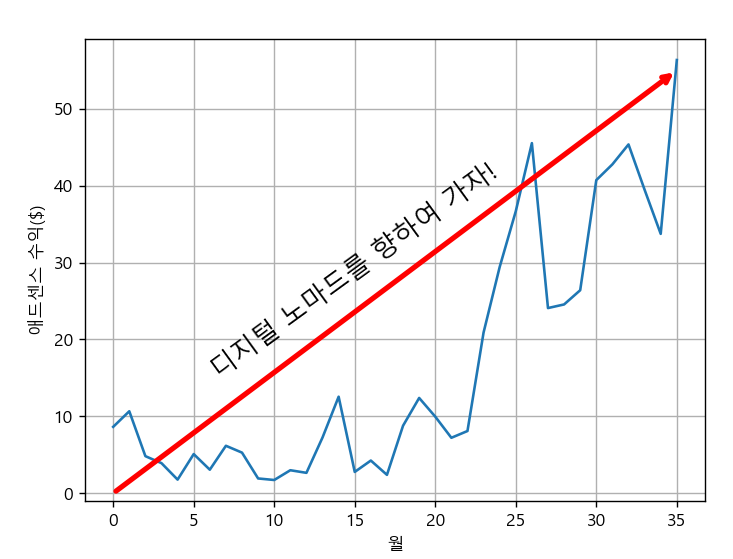 [matplotlib] 그래프에 화살표 및 텍스트 삽입하기
2022.06.27
 -
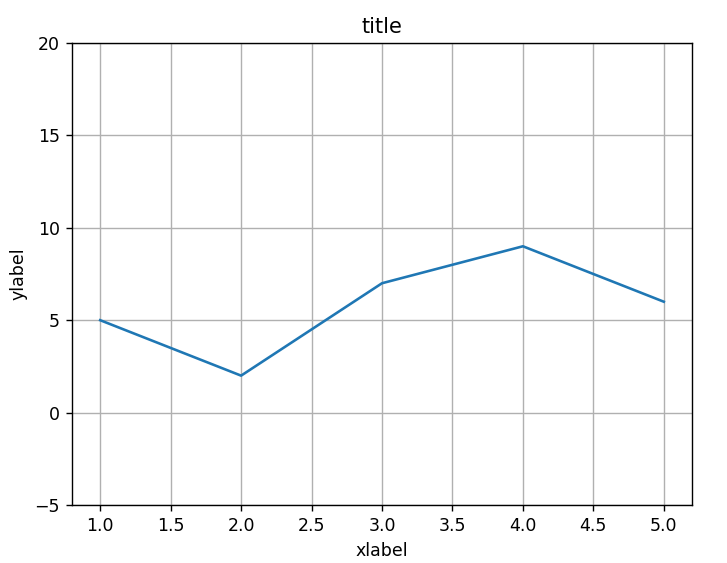 [matplotlib] 그래프의 y축 범위 지정하는 방법
2022.06.27
 -
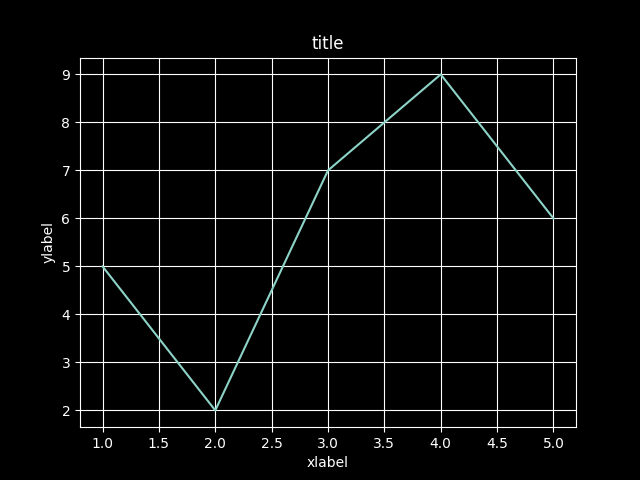 [matplotlib] 그래프 스타일 바꾸기
2022.06.26
 -
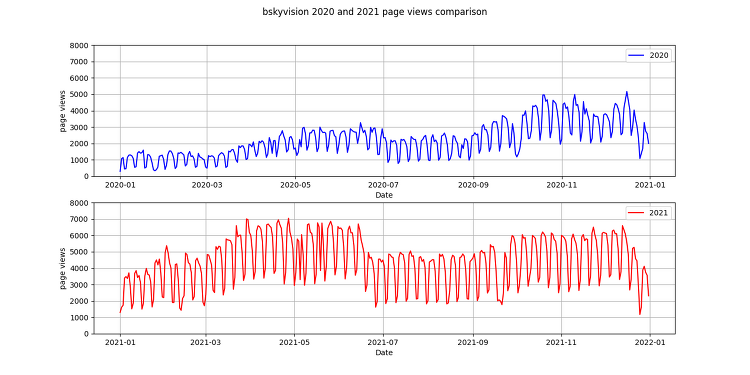 [matplotlib] 그래프 여러 개 서브플롯(subplot)으로 그리기
2022.06.21
 -
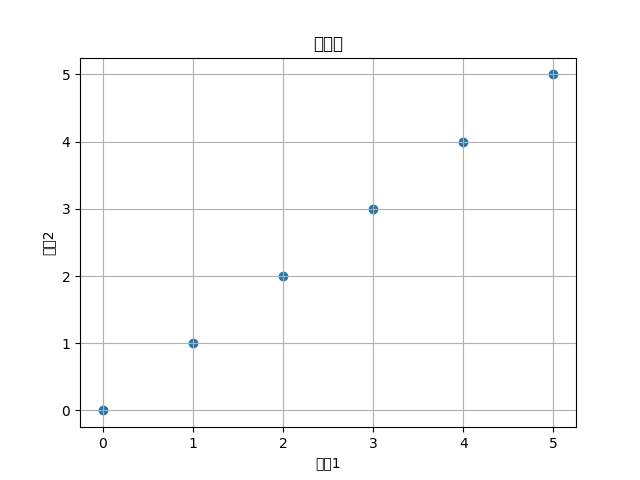 [python] matplotlib로 플롯 그릴 때 한글 깨짐 문제 해결 방법 (윈도우)
2021.03.08 2
 -
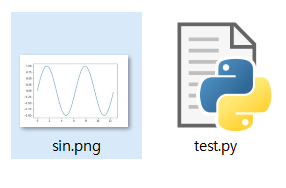 [python+matplotlib] matplotlib.pyplot으로 만든 plot 그림 파일로 저장하기, savefig()
2020.07.11
Copyright 2024. bskyvision.com. all rights reserved.
Designed by bskyvision.